On Sunday, October 4th, 2020, a 25-year-old-man fell to his death at Glen Canyon National Recreation Area in Arizona. When authorities recovered his body, they found the remains of other hikers who had suffered the same fate.
In July, 2020, a climber at Glacier National Park was killed on July 21, 2020, after falling several hundred feet off a ridge known as The Dragon’s Tail.
There were a string of accidents in Grand Canyon National Park in 2019, involving multiple people falling to their death.
An Israeli teen who, in 2018, fell off the cliff edge of Nevada Falls at Yosemite National Park after posing for a photo opportunity.
A man in 2016 who was boiled to death and “dissolved” after falling into one of Yellowstone’s famed thermal pools.
These reports – and others like them – led us to wonder:
How and how often do people die in America’s National Parks?
Which National Parks frequently have the most deaths?
We analyzed data from the National Parks Service (obtained through a Freedom of Information Act request) and found that thousands of people have died at U.S. National Parks since 2007.
In conjunction with data visualization agency 1Point21 Interactive, we analyzed the data and found the answer.
How often do people die in National Parks?
From 2007 to 2018, there were a total of 2,727 deaths at a U.S. National Parks site. While nearly 3,000 deaths is a very high number, it is spread across 12 years and hundreds of sites in the U.S. National Park system.
Additionally, there were an estimated 3.5 billion recreation visits to National Parks during that time frame. That equates to just under 8 deaths per 10 million visits to park sites during that time frame.
We feel that it is important to say that, based on our data, visiting U.S National Parks is very safe overall. However, this analysis is driven by curiosity, so we carry on.
National Park Deaths: Who and How?
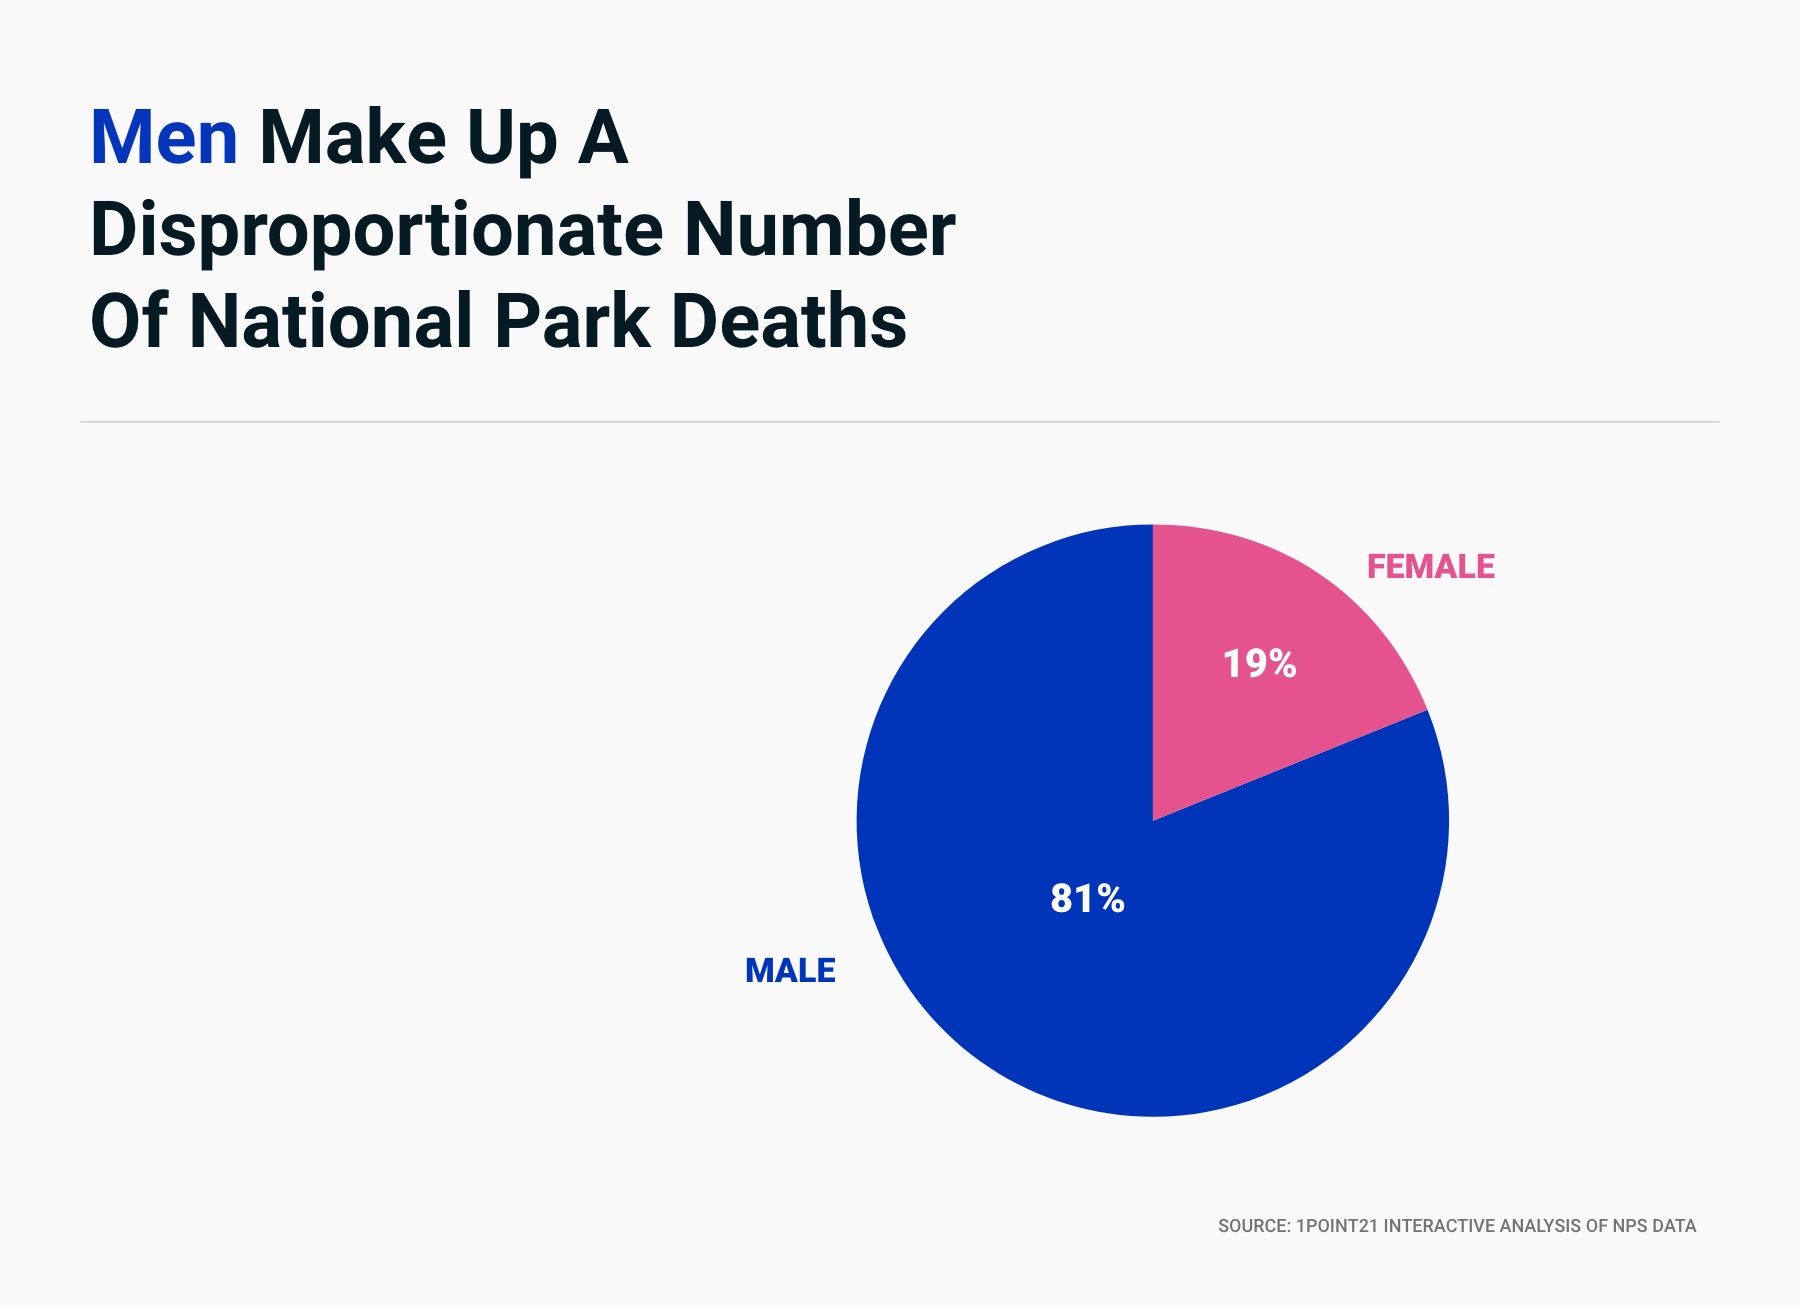
People of all ages and all walks of life visit our nation’s national parks. Yet men make up a disproportionate number of national park deaths, accounting for 81 percent of total fatalities.
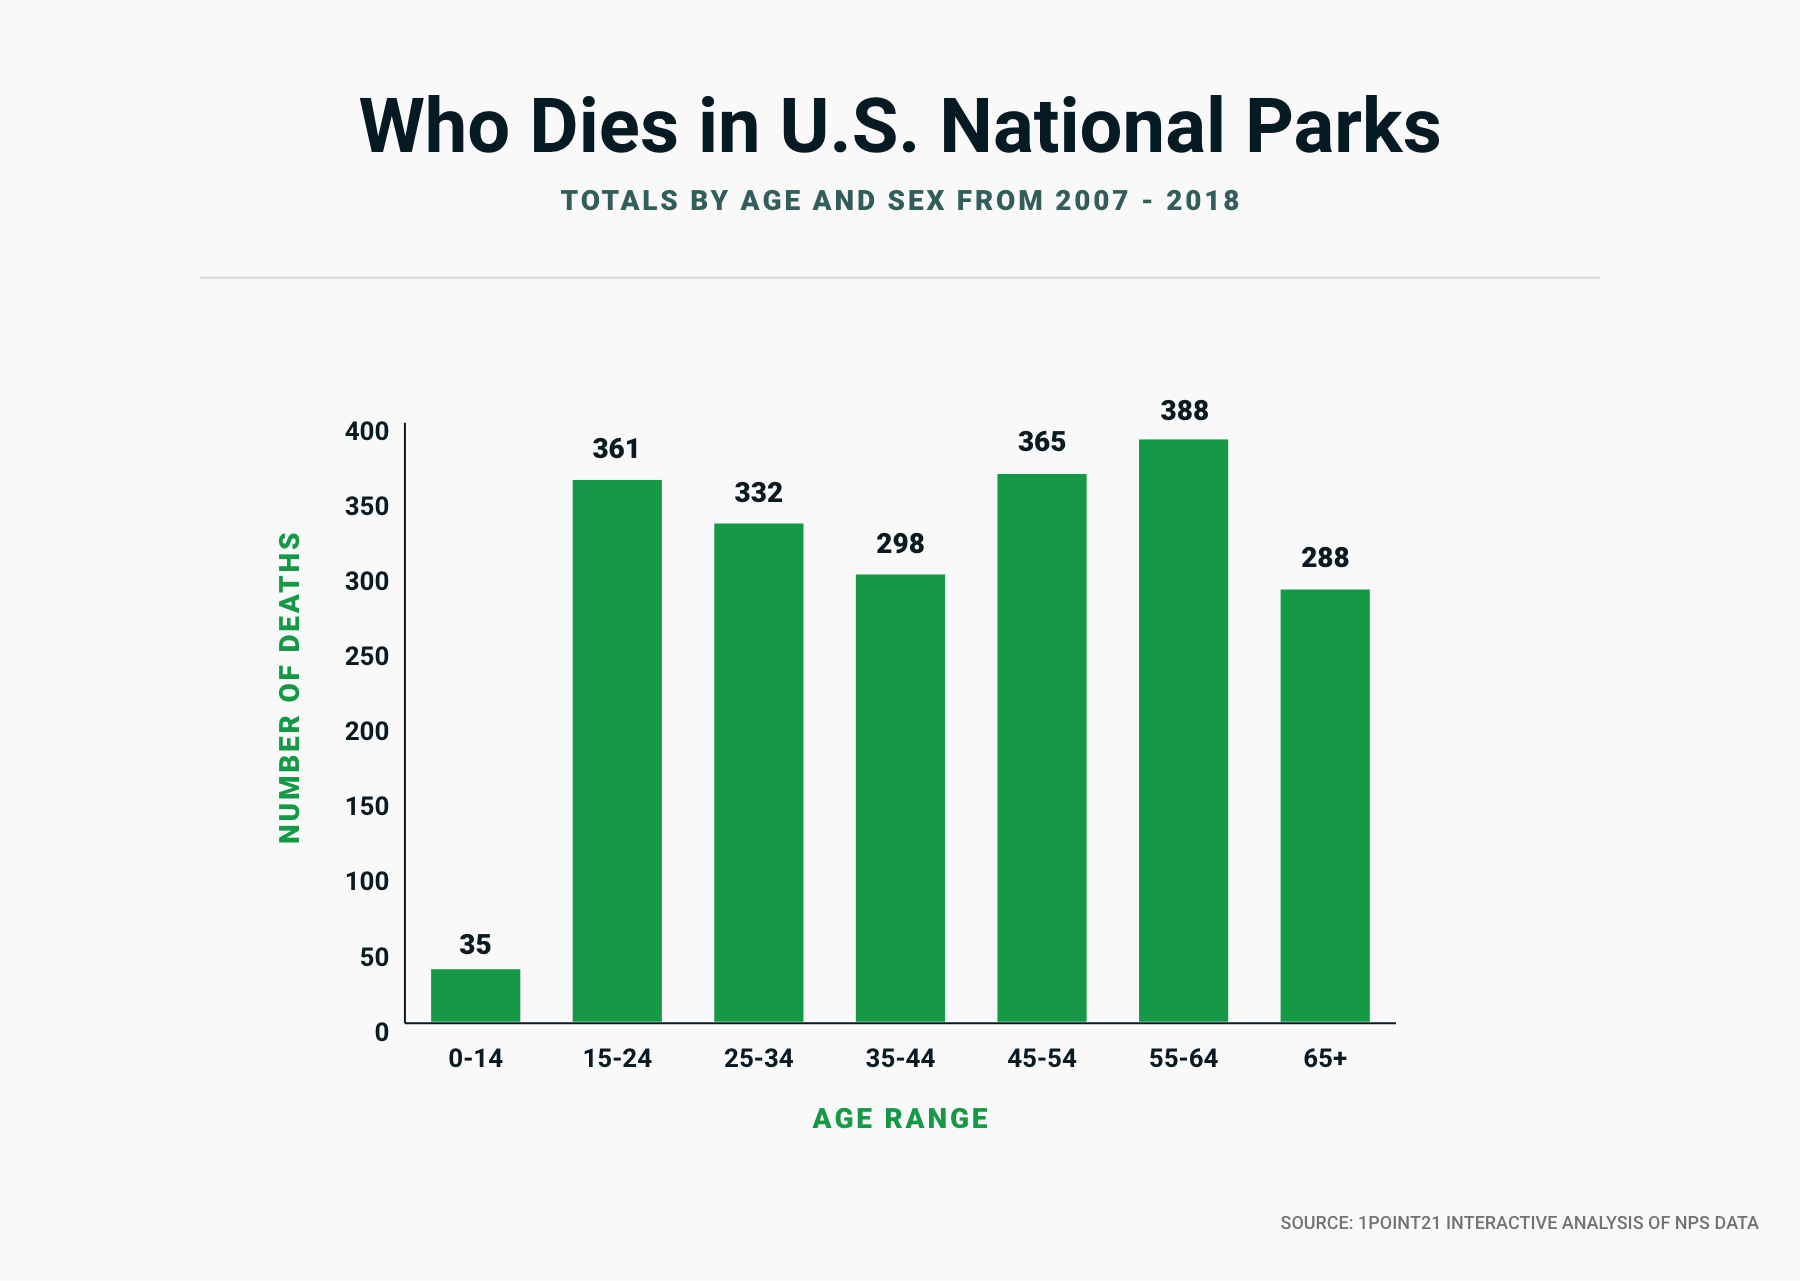
However, deaths are relatively evenly distributed among adult age ranges, with adults age 55 – 64 leading the way at 19 percent. Thankful, children make up a very small portion of fatalities, with 35 deaths among children age 14 and under (2 percent).
Drowning (668 deaths) is the Leading Cause of Death at national parks and national recreation areas. Drowning is followed by motor vehicle crashes (475 deaths), falls and slips (335), natural causes (285), and suicide (260). Interestingly, despite the abundance of wildlife at national parks, only eight people were killed by wild animals.
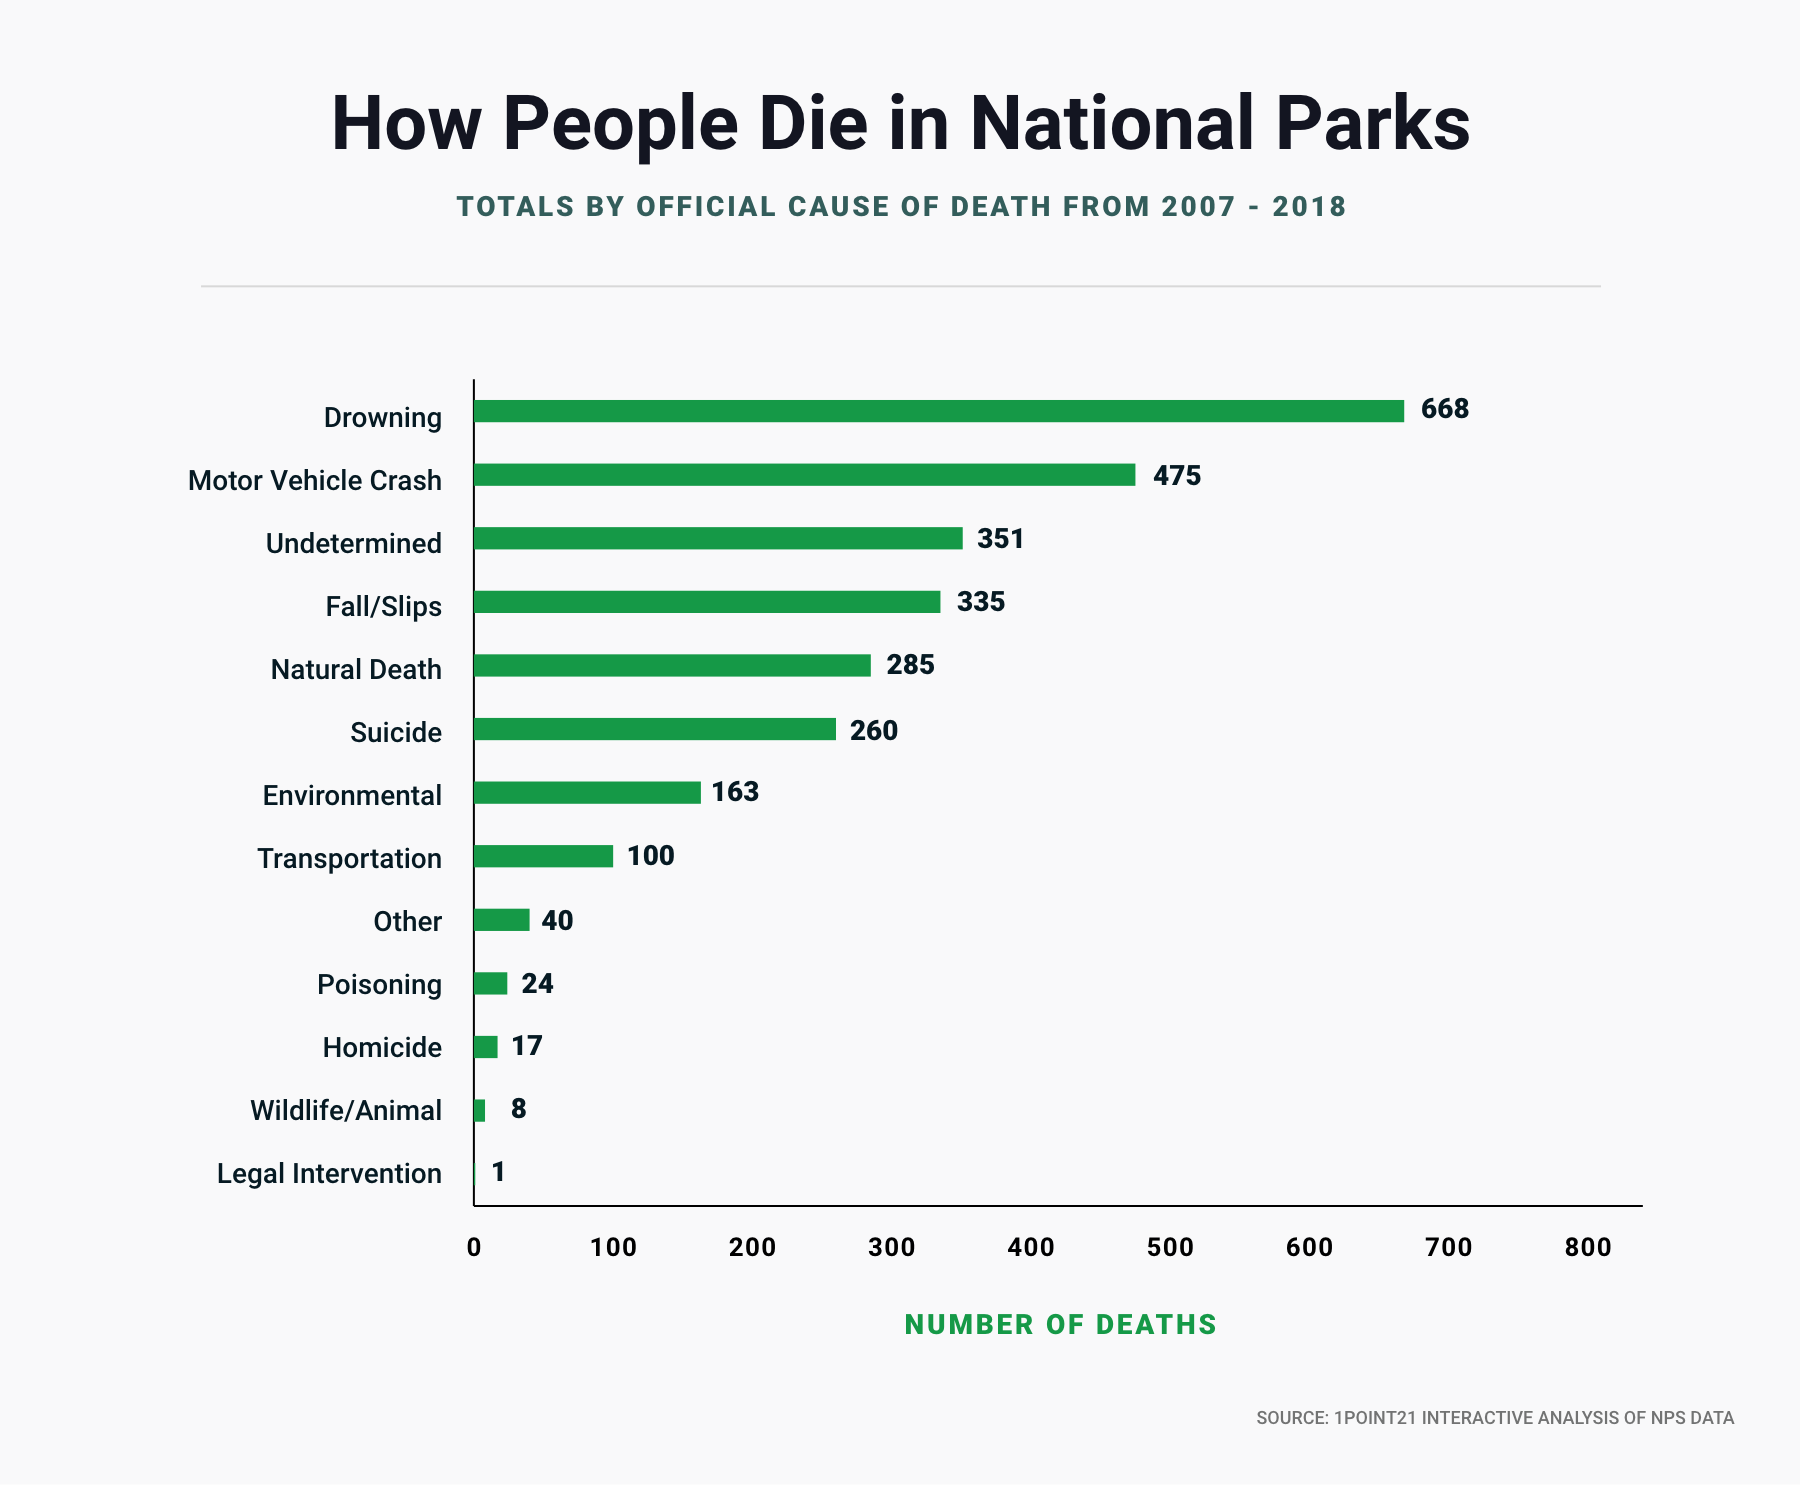
The number of car accidents may seem fairly high, but it makes sense, given the rural and scenic nature of most of these sites. Rural locations may empower drivers to exhibit more reckless habits with driving, such as not wearing seatbelts, speeding, distracted driving, and even driving under the influence. Further, scenic national parks usually have twisting, winding roads through mountains that can be difficult to navigate even for the most competent drivers. The potential for a crash into a tree or another vehicle – or even to careen off the road – is very real.
Which National Park Are you Most Likely to Die at?
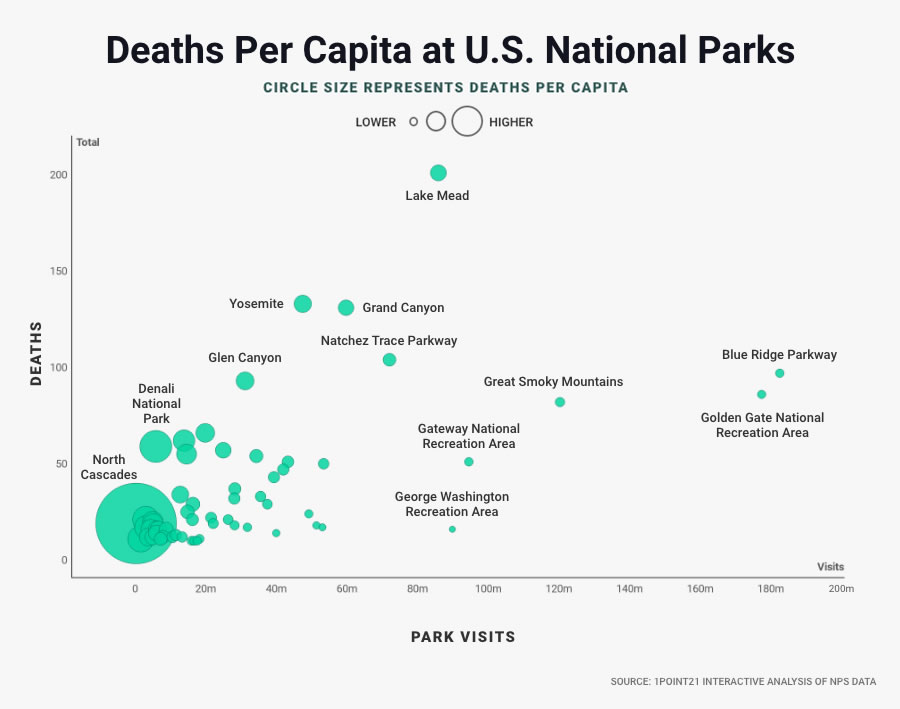
As you might expect, more people die at larger, more popular national parks and recreation areas. Only four parks saw more than 100 deaths during the study period:
- Lake Mead National Recreation Area – 201 deaths
- Yosemite National Park – 133 deaths
- Grand Canyon National Park – 131 deaths
- Natchez Trace Parkway – 131 deaths
However, just because more people have died at those parks, doesn’t necessarily mean you are most likely to die there than you are at any other park. Consider that these are among the most visited parks in the nation. For instance, there were more than 85 million recreational visits to Lake Mead during the years we measured.
In order to effectively measure this, we collected the total estimated recreational visits for each park, then adjusted the total deaths per 10 million visits (minimum 10 total fatalities).
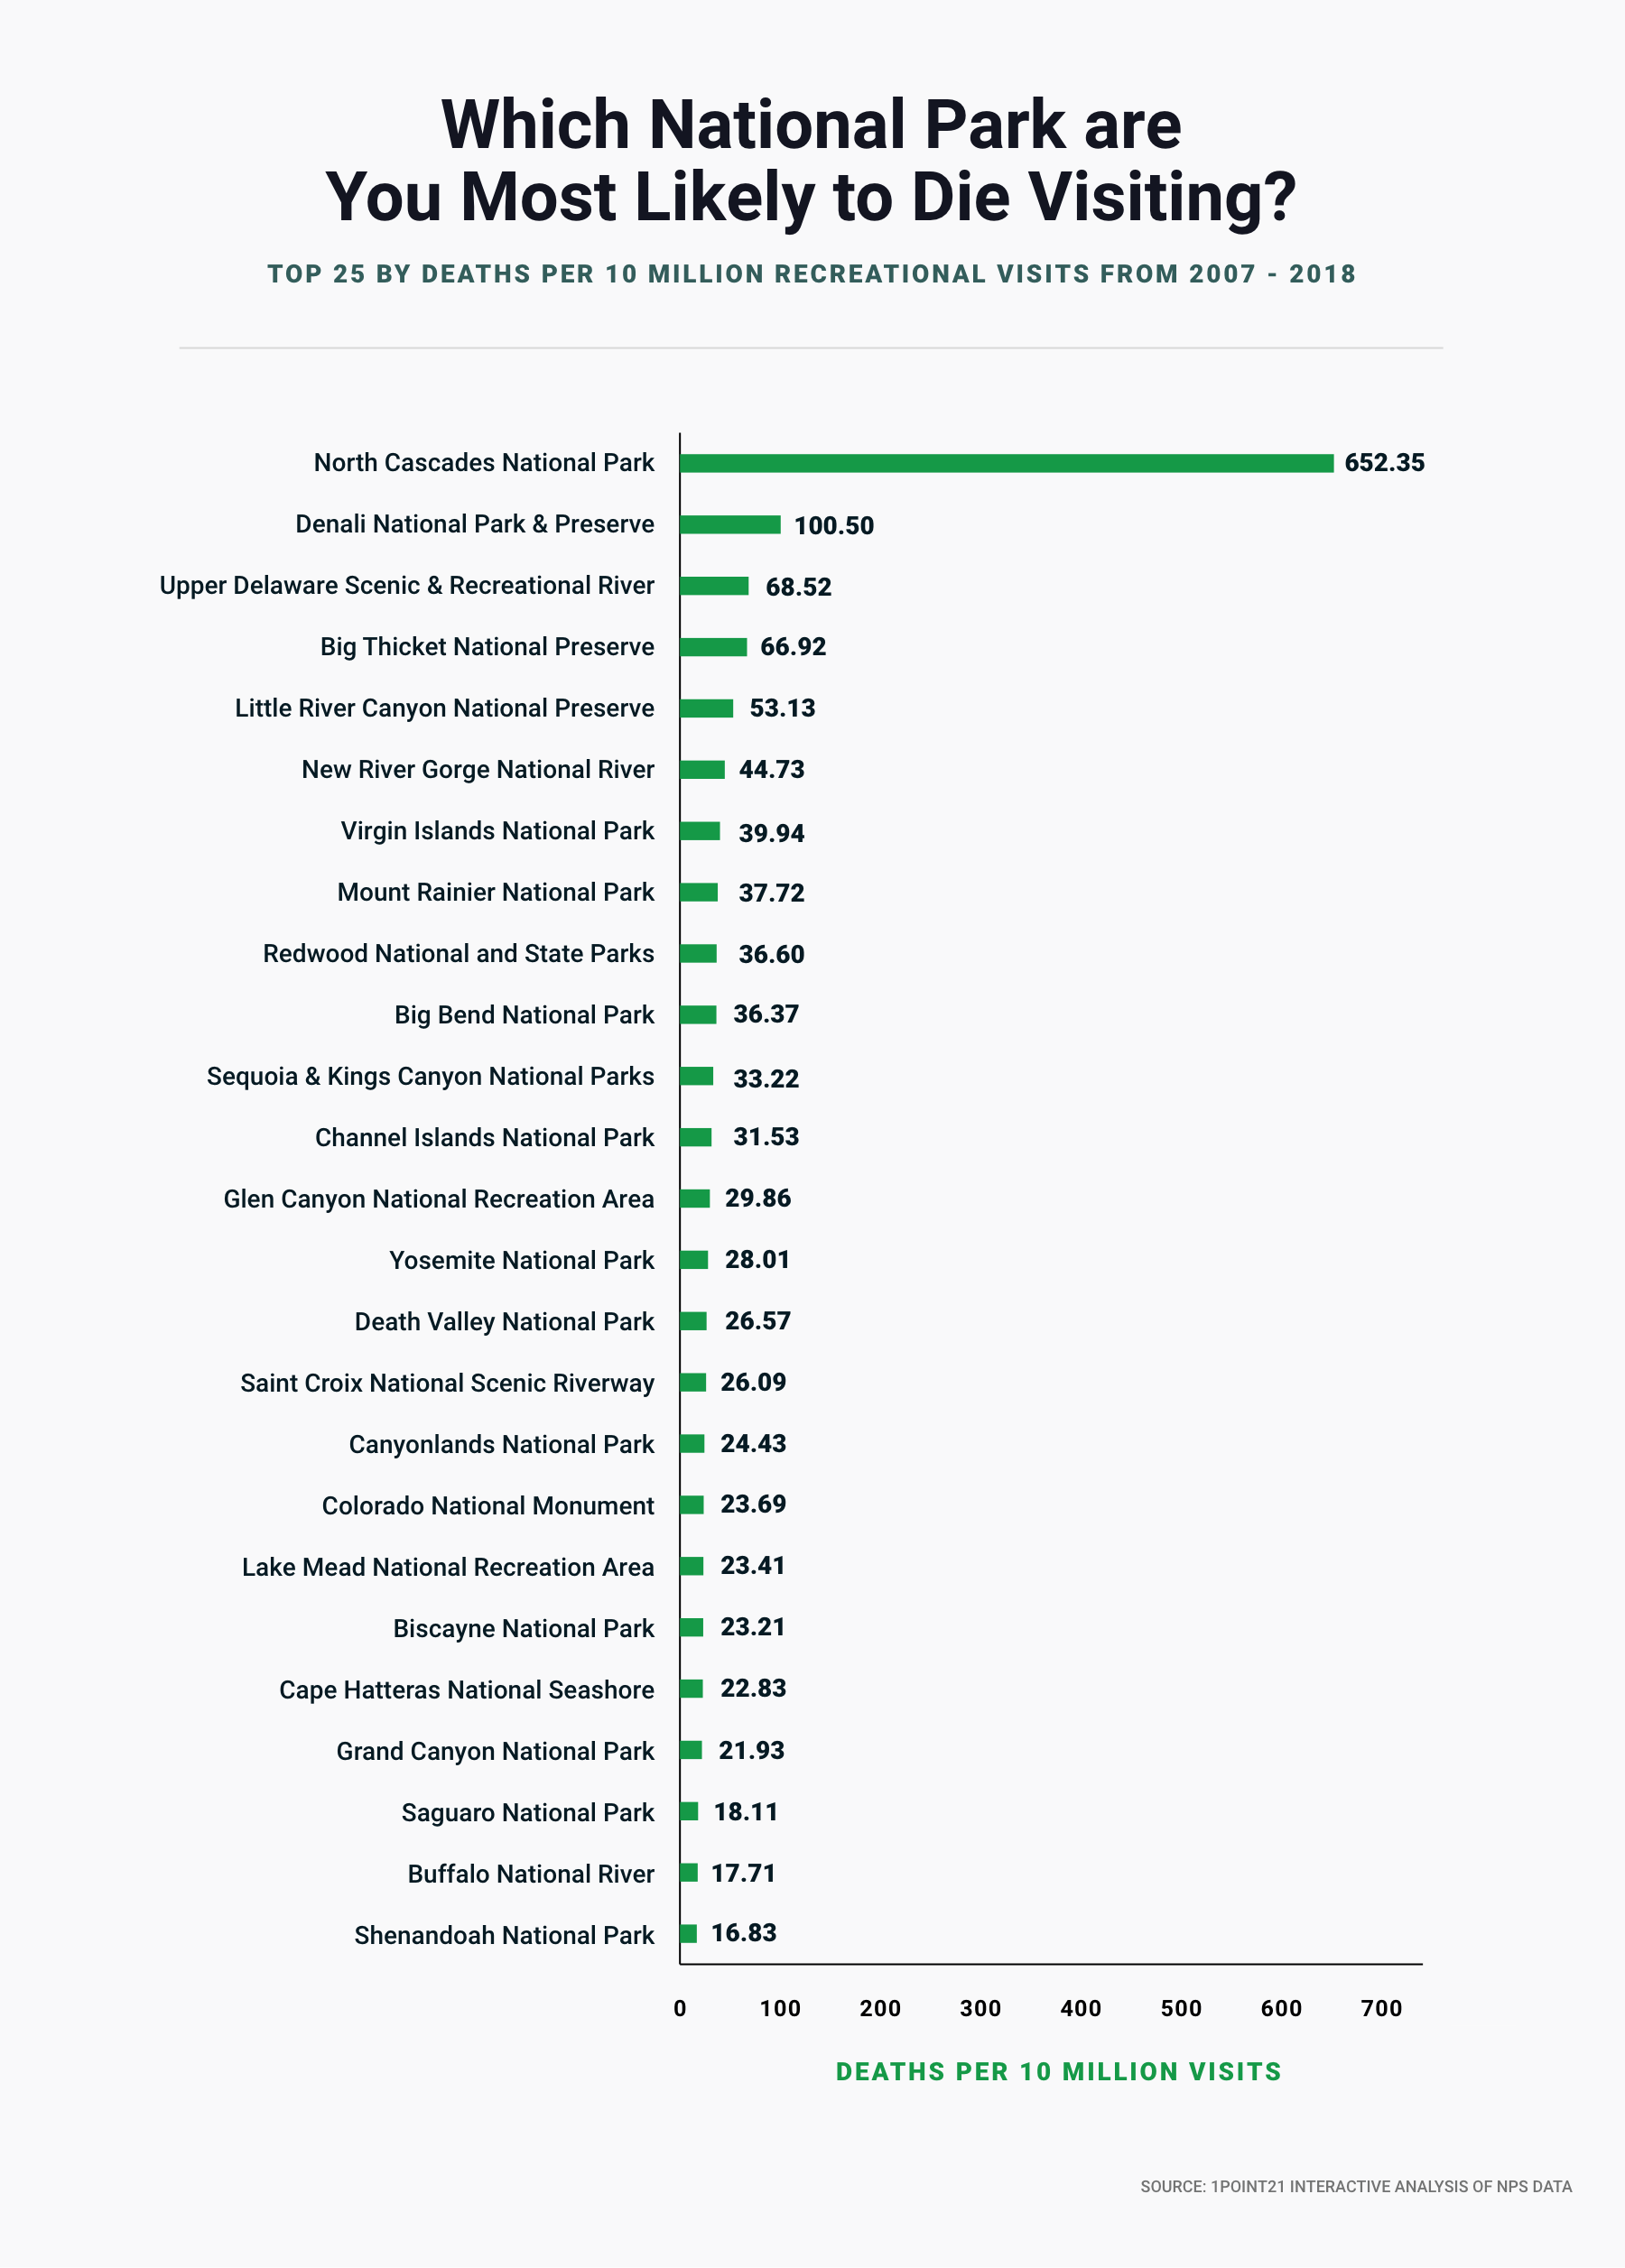
By this measure, you are – far and away – most likely to die at North Cascades National Park in Washington.
With only around 30,000 annual visitors, this 500,000-acre national park had the lowest total of any park with at least 10 fatalities. As a result, North Cascades National Park had a death rate of 652 per 10 million visits – 6.5 times higher than Denali National Park & Preserve (100) and nearly 22 times higher than the average (30).
| Rank | Park Name | Death Total | Park Visits (2007-2018) | Deaths per 10 Million Visits |
|---|---|---|---|---|
| 1 | North Cascades National Park | 19 | 291,255 | 652.35 |
| 2 | Denali National Park & Preserve | 59 | 5,870,403 | 100.50 |
| 3 | Upper Delaware Scenic & Recreational River | 21 | 3,064,806 | 68.52 |
| 4 | Big Thicket National Preserve | 11 | 1,643,769 | 66.92 |
| 5 | Little River Canyon National Preserve | 17 | 3,199,845 | 53.13 |
| 6 | New River Gorge National River | 62 | 13,860,271 | 44.73 |
| 7 | Virgin Islands National Park | 20 | 5,007,436 | 39.94 |
| 8 | Mount Rainier National Park | 55 | 1,4583,040 | 37.72 |
| 9 | Redwood National and State Parks | 19 | 5,191,506 | 36.60 |
| 10 | Big Bend National Park | 16 | 4,398,979 | 36.37 |
| 11 | Sequoia & Kings Canyon National Parks | 66 | 19,869,972 | 33.22 |
| 12 | Channel Islands National Park | 12 | 3,805,343 | 31.53 |
| 13 | Glen Canyon National Recreation Area | 93 | 31,147,953 | 29.86 |
| 14 | Yosemite National Park | 133 | 47,477,863 | 28.01 |
| 15 | Death Valley National Park | 34 | 12,798,741 | 26.57 |
| 16 | Saint Croix National Scenic Riverway | 16 | 6,133,431 | 26.09 |
| 17 | Canyonlands National Park | 16 | 6,550,367 | 24.43 |
| 18 | Colorado National Monument | 12 | 5,065,825 | 23.69 |
| 19 | Lake Mead National Recreation Area | 201 | 85,878,810 | 23.41 |
| 20 | Biscayne National Park | 14 | 6,032,231 | 23.21 |
| 21 | Cape Hatteras National Seashore | 57 | 24,963,998 | 22.83 |
| 22 | Grand Canyon National Park | 131 | 59,741,857 | 21.93 |
| 23 | Saguaro National Park | 16 | 8,832,663 | 18.11 |
| 24 | Buffalo National River | 29 | 16,373,311 | 17.71 |
| 25 | Shenandoah National Park | 25 | 14,852,349 | 16.83 |
| 26 | Grand Teton National Park | 54 | 34,325,043 | 15.73 |
| 27 | Big South Fork National River and Recreation Area | 12 | 7,867,465 | 15.25 |
| 28 | Padre Island National Seashore | 11 | 7,243,575 | 15.19 |
| 29 | Natchez Trace Parkway | 104 | 72,030,899 | 14.44 |
| 30 | Glacier National Park | 37 | 28,250,811 | 13.10 |
| 31 | Lake Roosevelt National Recreation Area | 21 | 16,240,491 | 12.93 |
| 32 | Yellowstone National Park | 51 | 43,283,275 | 11.78 |
| 33 | Point Reyes National Seashore | 32 | 28,103,884 | 11.39 |
| 34 | Lake Meredith National Recreation Area | 12 | 10,598,868 | 11.32 |
| 35 | Everglades National Park | 13 | 11,571,591 | 11.23 |
| 36 | Rocky Mountain National Park | 47 | 41,964,578 | 11.20 |
| 37 | Zion National Park | 43 | 39,313,822 | 10.94 |
| 38 | Joshua Tree National Park | 22 | 21,523,513 | 10.22 |
| 39 | Delaware Water Gap National Recreation Area | 50 | 53,380,361 | 9.37 |
| 40 | Chattahoochee River National Recreation Area | 33 | 35,544,736 | 9.28 |
| 41 | Haleakala National Park | 12 | 13,338,396 | 9.00 |
| 42 | Indiana Dunes National Lakeshore | 19 | 22,118,782 | 8.59 |
| 43 | Rock Creek Park | 21 | 26,360,244 | 7.97 |
| 44 | Olympic National Park | 29 | 37,472,214 | 7.74 |
| 45 | Great Smoky Mountains National Park | 82 | 120,305,421 | 6.82 |
| 46 | Cuyahoga Valley National Park | 18 | 28,181,547 | 6.39 |
| 47 | Ozark National Scenic Riverways | 10 | 16,030,792 | 6.24 |
| 48 | Hawaii Volcanoes National Park | 11 | 18,242,187 | 6.03 |
| 49 | Sleeping Bear Dunes National Lakeshore | 10 | 16,745,401 | 5.97 |
| 50 | Amistad National Recreation Area | 10 | 17,570,699 | 5.69 |
| 51 | Gateway National Recreation Area | 51 | 94,508,303 | 5.40 |
| 52 | Acadia National Park | 17 | 31,795,162 | 5.35 |
| 53 | Blue Ridge Parkway | 97 | 182,536,014 | 5.31 |
| 54 | Gulf Islands National Seashore | 24 | 49,204,556 | 4.88 |
| 55 | Golden Gate National Recreation Area | 86 | 177,394,212 | 4.85 |
| 56 | Chesapeake & Ohio Canal National Historical Park | 18 | 51,351,603 | 3.51 |
| 57 | Colonial National Historical Park | 14 | 39,977,457 | 3.50 |
| 58 | Cape Cod National Seashore | 17 | 53,034,104 | 3.21 |
| 59 | George Washington Memorial Parkway | 16 | 89,846,911 | 1.78 |
As you can see, adjusting for visits drastically affects each park’s position on this list. While Lake Mead had the most overall deaths, it ranked 19th on a deaths per visit rate. Blue Ridge Parkway, the most visited area, dropped all the way to 53 despite having the fifth most fatalities.
Lake Mead Leads the Way in Drowning Deaths
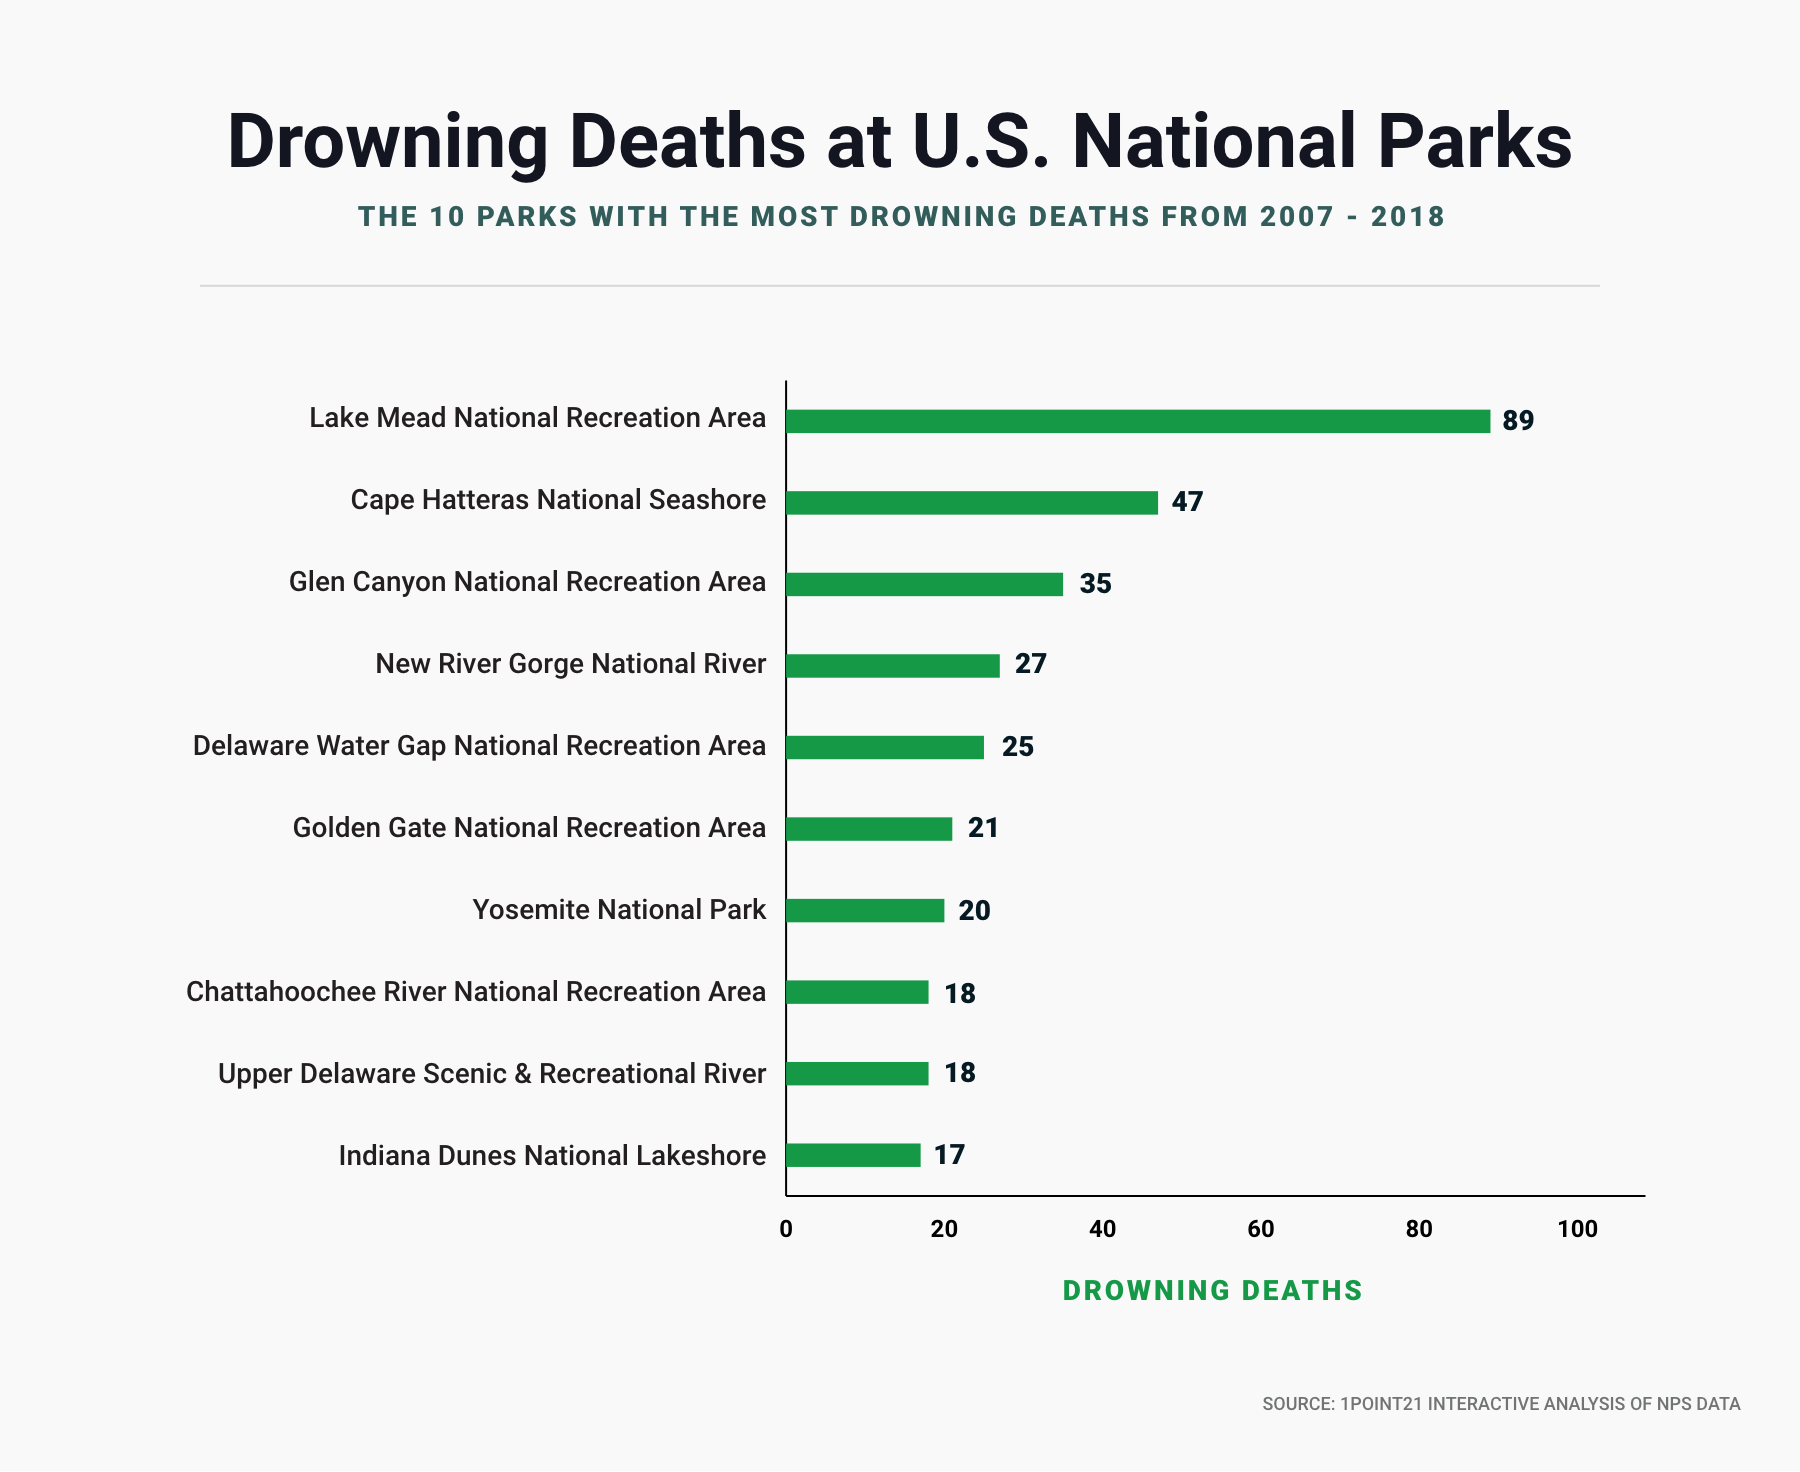
In addition to having the most overall deaths, Lake Mead National Recreation area led the way in drowning deaths as well. In fact, drowning was the leading cause of death at Lake Mead. With 89 drowning deaths, Lake Mead had nearly twice as many drowning deaths as the next highest park – Cape Hatteras National Seashore with 47. Glen Canyon National Recreation Area (35), New River Gorge National River (27), and Delaware Water Gap National Recreation Area (21) were third, fourth and fifth, respectively.
Multiple National Park Sites Have a High Number of Suicides
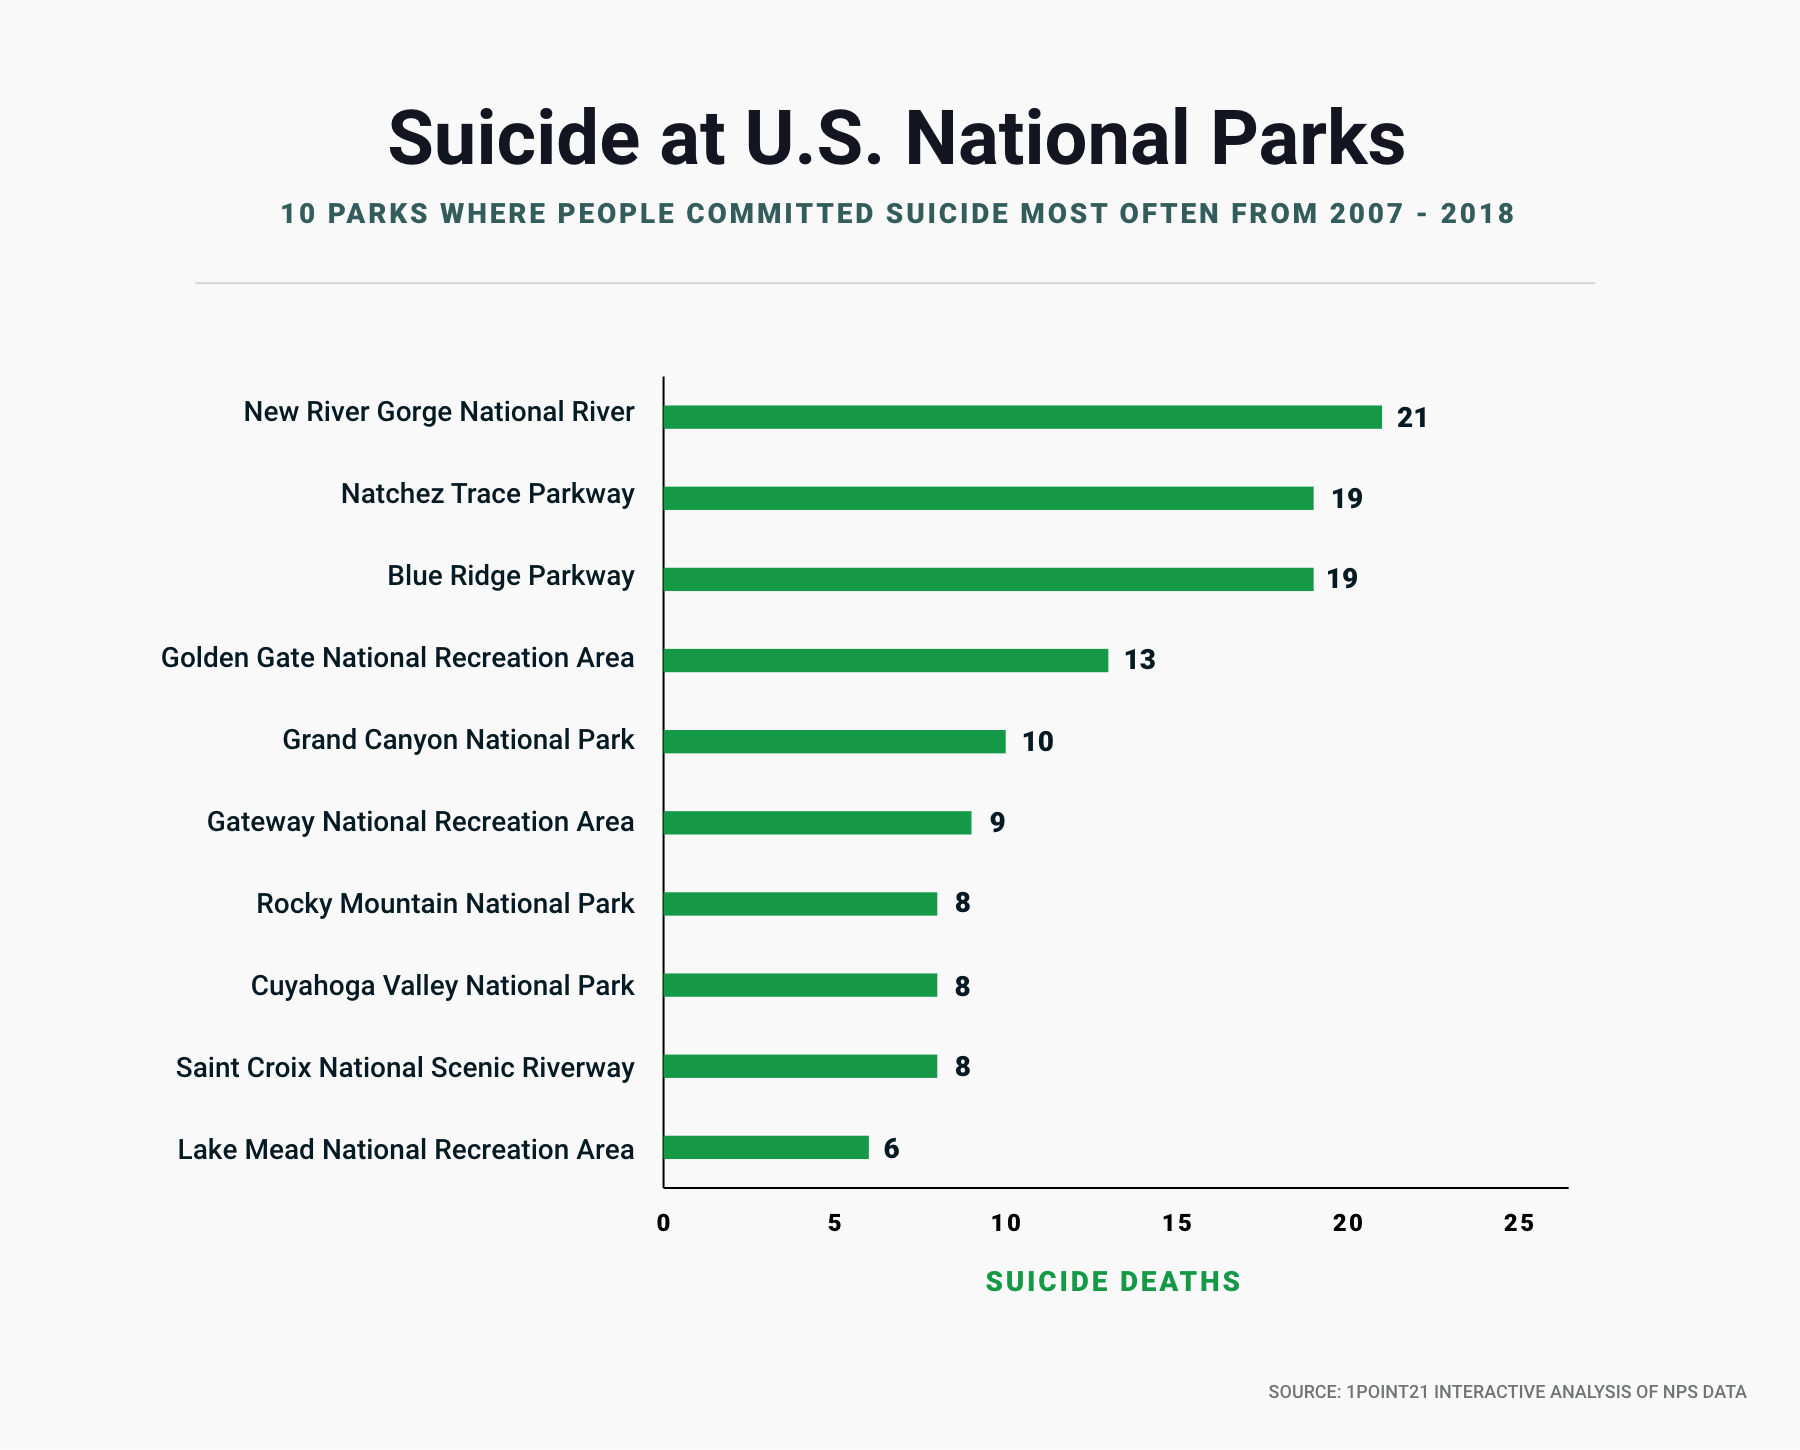
Unfortunately, three National Park sites in our analysis have a disproportionately high amount of suicides relative to the other listings. These include:
- New River Gorge National River, WV – 21 suicides
- Natchez Trace Parkway, TN & MS – 19 suicides
- Blue Ridge Parkway, VA & NC – 19 suicides
These three sites alone accounted for 23% of all National Park suicides from 2007-2018.
The high incidence of suicides at New River Gorge in southern West Virginia and Natchez Trace in Tennessee and Mississippi are likely due to bridges located within their respective areas that have become locally known as “suicide bridges.”
At 876 feet, the New River Gorge Bridge is the third-highest vehicular bridge in the United States. However, despite the staggering height, there are a distinct lack of barriers on the sides of the bridge. These conditions have made the bridge a famous location for BASE jumpers – and an unfortunately common site for suicides.
The Natchez Trace Parkway Bridge is a double arch bridge located at the northern end of the Parkway in Williamson County, Tennessee. Much like the New River Gorge Bridge, this site has become well known as a site for suicides – so much so that in 2011, suicide prevention hotline signs were posted along the bridge to would-be jumpers.
The cause for the high number of suicides in Blue Ridge Parkway are less clear. Considered America’s longest linear park, Blue Ridge spans 469 miles through Virginia and North Carolina, connecting Great Smoky Mountains National Park to Shenandoah National Park. There is no one site where suicides are more common, and there is seemingly no pattern for the high rate of suicides.
Other notable findings regarding suicide include:
- Golden Gate Recreational Area, CA – 13 total suicides, the fourth most among all sites
- Grand Canyon National Park, AZ – 10 people committed suicide in the Grand Canyon, ranking fifth
In addition, suicide was the leading cause of death in two National Park sites: Cuyahoga Valley National Park in Ohio, and Saint Croix National Scenic Riverway in Minnesota and Wisconsin. In both sites, suicides accounted for 44% and 50% of all deaths, respectively, for the previous 12 years.
Methodology and Fair Use
We examined fatality data provided by the National Park Service for the years 2007 – 2018 ( the latest available full year).
Visitation data was pulled manually from the National Park Services website.
If you wish to report on our findings or use any of the visual or data elements of this analysis, please provide attribution by linking to this page.
A Note on National Park Designations
It is important to note that the National Park Service (NPS) does not just supervise and maintain National Parks. There are numerous designations used by the National Park System to help classify and preserve sites that have natural and/or historical significance. This includes:
- National Parks
- National Monuments
- National Preserves
- National Historic Sites
- National Historical Park
- National Memorial
- National Battlefield
- National Cemetery
- National Recreation Area
- National Seashore or Lakeshore
- National River
- National Parkway
- National Trail
Other sites managed by the National Parks System may have unique designations, such as the White House or the National Mall.
Despite all of these varying designations, the National Park Service has declared that all sites are equal in terms of legal standing, with equal privileges and rights as pertaining to the land. Therefore, our analysis includes all sites managed by the NPS and is not just limited to National Parks.