The Most Dangerous Elementary School Zones in California [New Study]
Request Free Consultation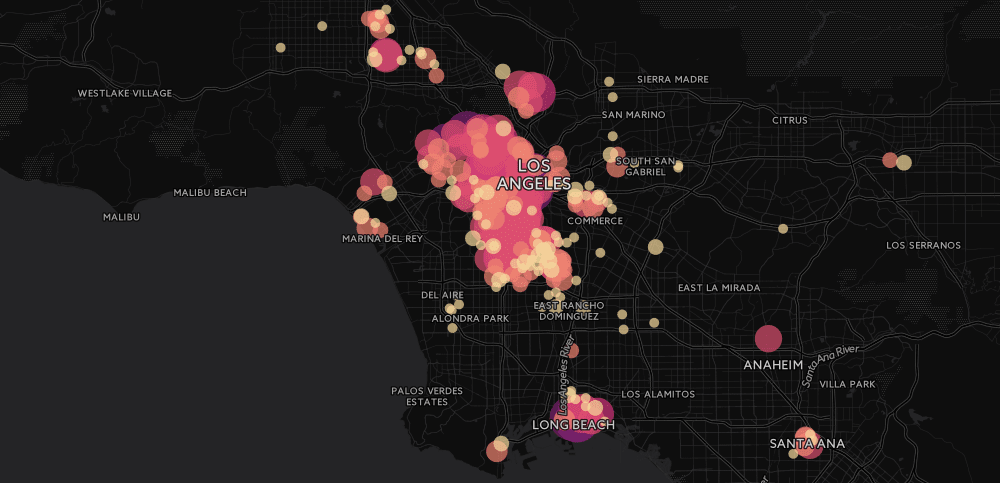
In 2016/17, well over six million students will attend California’s 10,453 public schools on any given school day. Of these students, more than 3.1 million are of elementary school age:
That’s over three million children under the age of 12 (most of whom are under ten) in cars, on buses, on bikes or on foot traveling between home and school twice a day, five days a week.
Getting to school everyday – be it as a vehicle passenger, pedestrian, or bicyclist exposes our kids to the leading cause of death for children in the United States: motor vehicle traffic-related crashes. While exposure to this danger is impossible to avoid entirely, understanding which school zones pose the most risk for injury can help parents make choices to mitigate it.
As consumer safety advocates – and parents ourselves – we wanted to find out which California elementary schools are the most dangerous for students getting to and from school. So, we enlisted data visualization firm 1Point21 Interactive to help us do the heavy lifting. With their help, we analyzed over 400,000 motor vehicle collision records from 2015 and compared them against the location of over 6,000 California elementary schools in order to catalogue every car, pedestrian and bicycle accident within 1/2 mile of each.
After reviewing our findings, here are the 486 California elementary schools with the riskiest routes for students:
The Most Dangerous Elementary School Zones in California
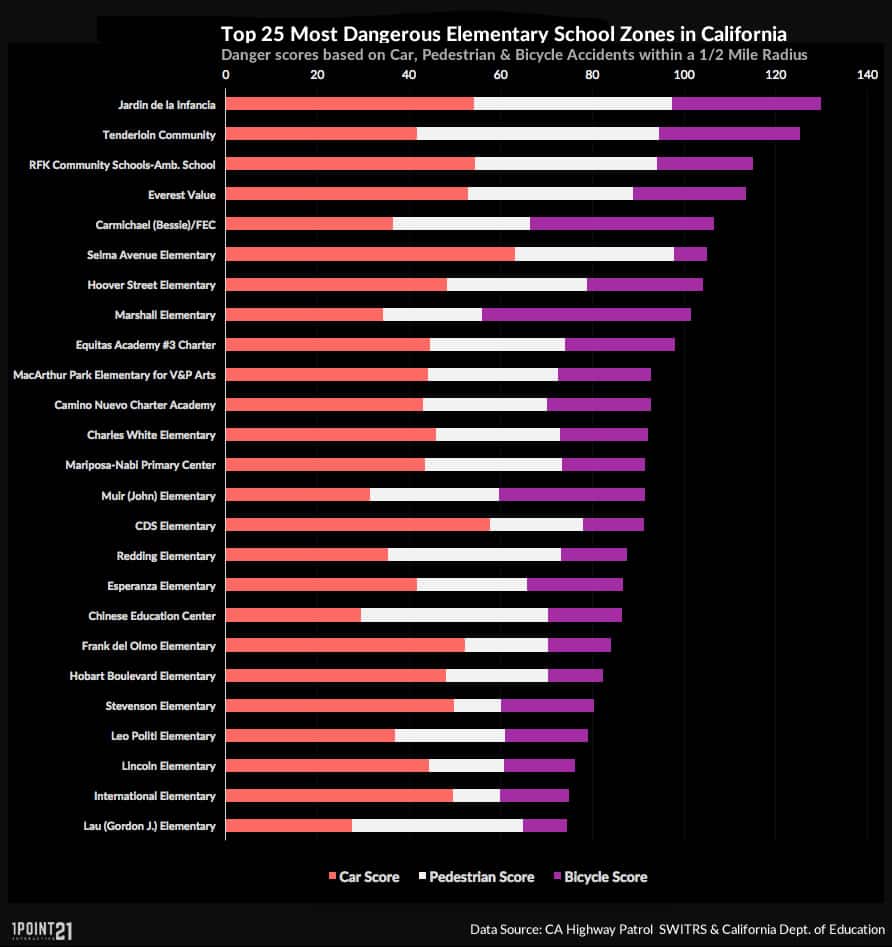
*For this study, the term ‘school zone’ – as well as the data listed for each school – includes a 1/2 mile radius around each school. For more information, see our methodology section below..
Interactive Map
Zoom in on any area of the map for a more detailed view. Hover over the circles for information on the school name and total number of pedestrian, bicycle and motor vehicle accidents. Larger circles represent more dangerous school zones.
Key Findings
There were a total of 62,785 car accidents, 6716 pedestrian accidents, 5,114 bicycle accidents within 1/2 mile of the 486 schools in our study.
- 215 of the schools are located in Los Angeles, 38 in Oakland, 31 in San Francisco.
- 23 of the 25 most dangerous schools in our study are located in Los Angeles and San Francisco.
- Four of the five schools with the highest number of bicycle accidents within 1/2 mile are located in San Francisco.
- School with the most car accidents within 1/2 mile: Selma Avenue Elementary in Los Angeles.
- School with the most pedestrian accidents within 1/2 mile: Tenderloin Community in San Francisco.
- School with the most bicycle accidents within 1/2 mile: Marshall Elementary in San Francisco.
- Averages for schools in our study: 133.01 car accidents, 14.22 pedestrian accidents, 10.83 bicycle accidents, 41.64 total score.
A tale of two schools
The two highest scoring (read: most dangerous) schools in our study are Jardin De La Infancia in Los Angeles and Tenderloin Community in San Francisco.
#1 – Jardin De La Infancia – Los Angeles
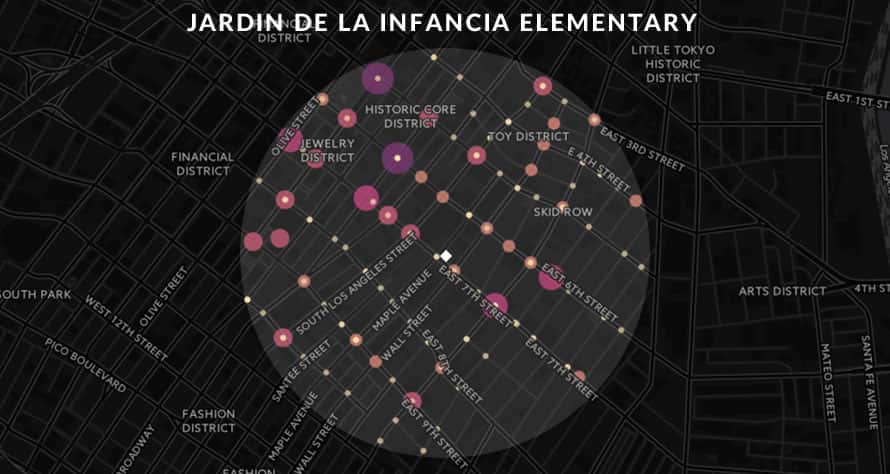

Total Score: 129.80
Car Accidents: 271
Pedestrian Accidents: 72
Bicycle Accidents: 54
#2 – Tenderloin Community – San Francisco
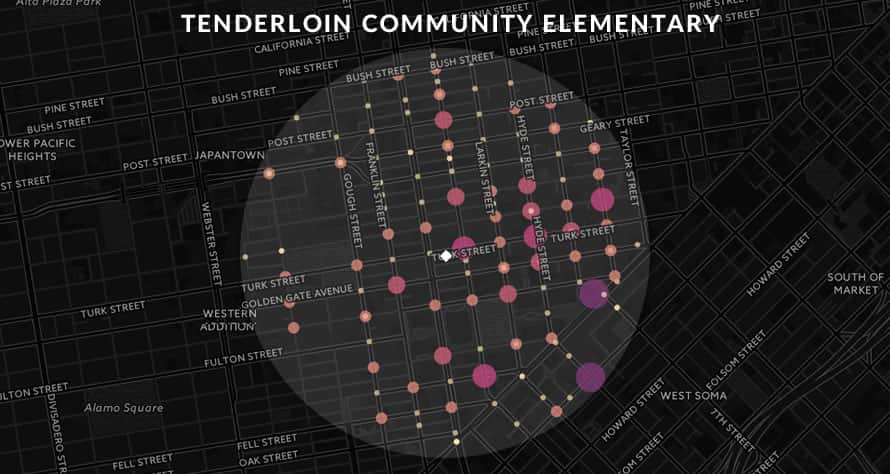
Total Score: 125.20
Car Accidents: 209
Pedestrian Accidents: 88
Bicycle Accidents: 54
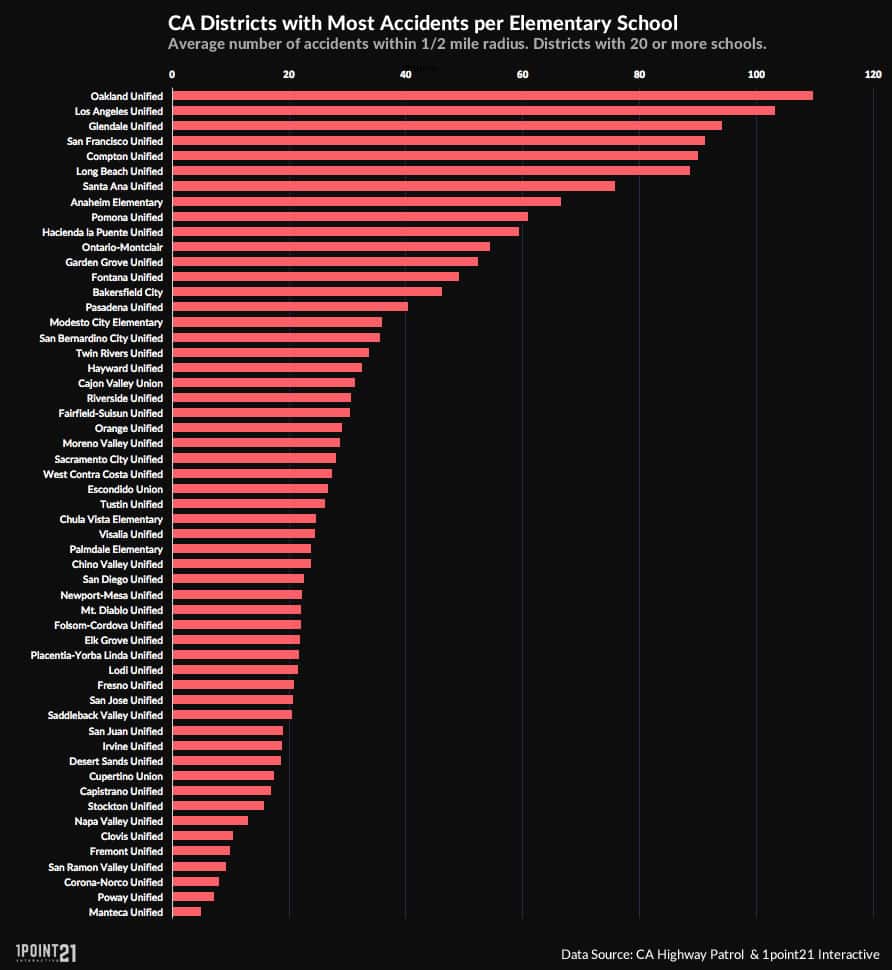
Larger School Districts
Of school districts with 20 or more elementary schools, Los Angeles had the highest number of accidents near elementary schools with over 62,000 within a 1/2 mile. This comes as no surprise considering Los Angeles has significantly more schools than any other school district in the state. However, when looking at the average number of accidents per elementary school, Oakland Unified had the highest number per capita, at 109.64. followed by Los Angeles (103.10), Glendale (94.15), San Francisco (91.15) and Compton (89.96).
With the high number of schools listed in Los Angeles, we created a tool specifically for L.A. parents to check the safety score of their child’s school. Visit our Los Angeles School Zone Safety Tool to see where your child’s school ranks in the county.
A Bit About Getting To School
Pedestrians and bicyclists of any age are among the most vulnerable users of the road, but children – due to their small size and inability to judge speed and distance – are at even greater risk of serious injury or death in pedestrian accidents. In 2009, over 23,000 children ages 5-15 were injured and another 250 were killed walking or riding their bikes in the U.S.
On average, only 13 percent of children age 5- 14 walk or bicycle to school everyday. However, the distance that children live from school makes a huge impact on how they get there. According to the National Household Travel Survey by the U.S. DoT, nearly 80 percent of students age 6-12 walk or bike to school if they live within 1/4 of a mile from school.
While children walking or biking to school are more vulnerable to injury, the risk does not drop to zero if they ride the bus or are dropped off at school. As more and more parents drop their kids off at school, these trips begin to account for a higher and higher percentage of total rush hour trips and contribute heavily to traffic congestion. In 2009, American families made 6.5 billion vehicle trips, driving over 30 billion miles, to take their children to and from school. This accounted for as much as 14 percent of all traffic during morning and afternoon commutes. Nationally, the motor vehicle fatality rate is 11.2 per billion vehicle miles traveled while the injury rate sits at 780 per billion VMT. On a simple rate basis, 30 billion miles of school trips may have resulted in 336 traffic fatalities and 23,400 injuries (all estimates and hypothetical based on overall rates, of course).
Tips For Getting Kids to School Safely
- Take Your Kids To School: We know this isn’t always possible, but if it is, it’s a great way to ensure your children get to school safely. If you can’t, talk to other parents nearby who do drive their kids to school and see if you can carpool.
- Plan a Safe Route: If parents can’t accompany their kids to and from school, take some time after work to walk to your child’s school and find the safest possible route. Look for streets with sidewalks, intersections with stop lights and crosswalks, also look for streets with less traffic and encourage your kids to take this route.
- Lead By Example: The best way to teach your kids to be safe while walking or biking to school is by leading by example. Whenever you are walking, make sure to stay aware of your surroundings, put your phone away, look both ways, always use a crosswalk, and teach your kids safe walking habits by practicing them yourself.
- Get Other Parents Involved: Talk to other parents about creating a walking group that walks to school together. Just one adult in the group can make a big difference and help kids commute safely.
- Get On Your Kids Level: The world looks a lot different to a child than it does an adult. At 3 or 4 feet tall, their view is severely altered and often they can’t see over cars or obstructions that adults can. Take a look at the world and streets from their perspective to identify potential dangers and address them accordingly.
- Teach Kids to Walk In Groups: If adults are not available, encourage your kids to walk with friends. The larger a group is, the easier it is for drivers to see and the more eyes will be on oncoming traffic.
- Start a Safe Routes to School Program: If your community doesn’t have a Safe Routes to School Program, look into starting one. Talk to your principal or teachers to get them on board. You can find more information on the Safe Routes to School National Partnership webpage.
This study was conducted by data visualization firm 1point21 Interactive and the Panish | Shea | Ravipudi LLP personal injury attorneys serving Orange County, Los Angeles, Riverside, and San Bernardino.
Methodology
In order to find the California schools zones that are most dangerous for children going to and from, we queried and collected all 2015 collision records from the California Highway Patrol’s SWITRS database – well over 435,000 individual records. Next, we removed any collisions that took place on a highway or freeway from our list. Then we compared them against the geolocation of every single elementary school in California – over 6,000 of them – to identify all collisions that occurred within a 1/2 mile of each school
Once we had the raw numbers, we calculated each school’s score by breaking down the collisions by type: motor vehicle, pedestrian, and bicycle.
Weights used in our formula: Accident (1) + Pedestrian Accident (3) + Bicycle Accident(3)
Pedestrian and bicycle collisions were weighed more heavily in our score, as these road users – especially when they are children – are much more vulnerable to injury and death than those in motor vehicles.
Our list shows the 486 schools with a score of 25 or higher – nearly 3 times the average score for all elementary schools (8.69)
Data Sources: